The U.S. corrections system houses 1.46 million prisoners in its 1,833 state prisons, 110 federal prisons, 1,772 juvenile detention centers, and 3,134 local jails, as of 2018, according to the U.S. Department of Justice.
While the number of prisoners has gone down from last year, the U.S. remains the world leader in incarceration, putting 655 people behind bars for every 100,000 Americans, according to the Prison Policy Initiative.
The cost to house, feed, and educate inmates comes at a cost. There isn’t a nationwide prison management plan that dictates things like budget, staffing ratios, or healthcare contracts. Instead, each state is left to handle its own prison system. As a result, the average cost of incarceration varies wildly state to state.
For a closer look at the cost of incarceration, we’ve pulled together data from government sources and crunched some of our own data to get a better look at the price tag that prisons come with.
How much does each state spend on its prison system?
To house inmates, correctional facilities must provide a safe environment, food, programs, healthcare, recreational and educational opportunities, all of which cost money. In addition, there are building expenses like maintenance, heat, and electricity.
Nationwide, $4.9 billion is spent on the prison system, according to the Bureau of Justice.
The amount each state spends varies greatly, has risen dramatically over the years, and is impacted by a variety of factors that change by state.
California, Texas, New York have the highest prison spending
California tops the list by spending about $9.3 billion dollars on its 33 state prison facilities in 2016, according to the most recent data from the Bureau of Justice Statistics. That’s more than double the amount of money that Texas spends, which is $3.7 billion. New York comes in third with annual spending topping $3.2 billion.
- California: $9.3 billion
- Texas: $3.7 billion
- New York: $3.2 billion
Aside from these three states, another 14 states spend north of $1 billion each year including Arizona, Florida, Georgia, Illinois, Maryland, Massachusetts, Michigan, New Jersey, North Carolina, Ohio, Pennsylvania, Virginia, Washington, and Wisconsin.
North Dakota, New Hampshire, and South Dakota spend the least on prisons
Meanwhile, North Dakota, New Hampshire, and South Dakota spend the least.
North Dakota spends just over $100 million a year on its correctional facilities, followed by New Hampshire at $122 million and South Dakota at $126 million.
- North Dakota: $100 million
- New Hampshire: $122 million
- South Dakota: $126 million
There are 19 states that spend less than $500 million per fiscal year including:
- Arkansas
- Delaware
- Hawaii
- Idaho
- Iowa
- Kansas
- Louisiana
- Maine
- Mississippi
- Montana
- Nebraska
- Nevada
- New Mexico
- Rhode Island
- South Dakota
- Utah
- Vermont
- West Virginia
- Wyoming
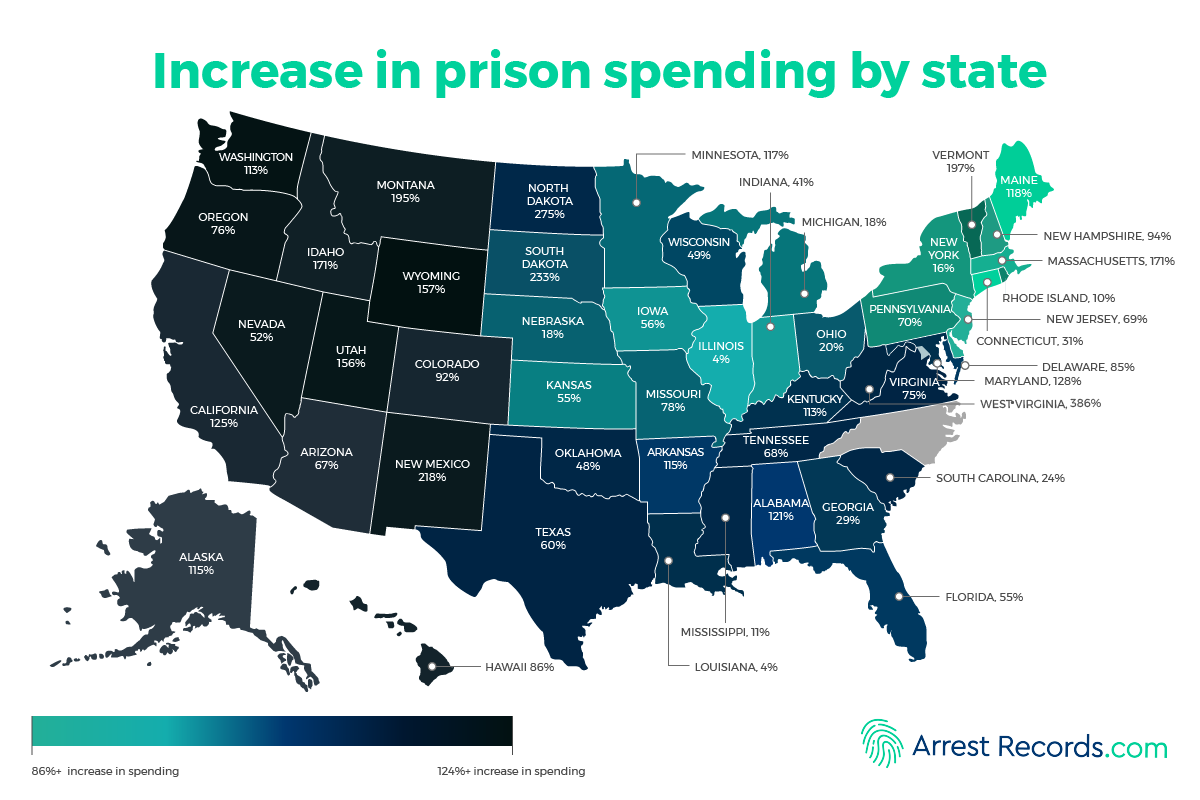
Spending has increased 95% since 2001
Spending has grown over time. On average, states are spending 95% more on its prison systems today than in 2001.
Overall, 21 of the 49 states that we collected data for have seen more than a 95% increase between 2001 and 2018. However, some spending has soared well beyond 95% in certain states.
According to our research, West Virginia saw a 386% increase in spending from 2001 to 2018. The state went from $61 million to $301 million over the course of 17 years.
North Dakota, which spent the least amount of money on its prison system in 2018, saw a dramatic increase in spending as well. The state’s prison expenditures shot up 275% with an increase of $73 million over the last 17 years.
South Dakota, a state also known for its minimal spending on corrections, saw a big jump between 2001 and 2018. Spending went from $37 million in 2001 to $125 million in 2018; a 233% increase.
Sky-high spending isn’t the case for every state though. Two states, Louisiana and Illinois, only had a 4% increase in spending between 2001 and 2018.
Here’s a look at prison spending (in the thousands) for 2001 and 2018 by state and the percentage of change seen during that time.
Change in prison spending by state, 2001-2018
| State | 2001 | 2018 | % Change | Region |
|---|---|---|---|---|
| Connecticut | $ 523,960.00 | $ 684,159.00 | 31% | Northeast |
| Maine | $ 76,479.00 | $ 166,878.00 | 118% | Northeast |
| Massachusetts | $ 413,071.00 | $ 1,119,463.00 | 171% | Northeast |
| New Hampshire | $ 62,754.00 | $ 122,052.00 | 94% | Northeast |
| New Jersey | $ 799,560.00 | $ 1,348,277.00 | 69% | Northeast |
| New York | $ 2,807,259.00 | $ 3,247,108.00 | 16% | Northeast |
| Pennsylvania | $ 1,203,219.00 | $ 2,047,717.00 | 70% | Northeast |
| Rhode Island | $ 124,333.00 | $ 136,813.00 | 10% | Northeast |
| Vermont | $ 46,128.00 | $ 136,813.00 | 197% | Northeast |
| Illinois | $ 1,011,311.00 | $ 1,056,155.00 | 4% | Midwest |
| Indiana | $ 477,628.00 | $ 671,698.00 | 41% | Midwest |
| Iowa | $ 188,391.00 | $ 294,006.00 | 56% | Midwest |
| Kansas | $ 199,843.00 | $ 310,182.00 | 55% | Midwest |
| Michigan | $ 1,582,611.00 | $ 1,870,535.00 | 18% | Midwest |
| Minnesota | $ 253,385.00 | $ 548,778.00 | 117% | Midwest |
| Missouri | $ 436,081.00 | $ 774,511.00 | 78% | Midwest |
| Nebraska | $ 126,857.00 | $ 362,811.00 | 18% | Midwest |
| Ohio | $ 1,277,622.00 | $ 1,537,482.00 | 20% | Midwest |
| South Dakota | $ 37,529.00 | $ 125,080.00 | 233% | Midwest |
| Wisconsin | $ 709,292.00 | $ 1,055,470.00 | 49% | Midwest |
| Alabama | $ 228,871.00 | $ 504,743.00 | 121% | South |
| Arkansas | $ 199,003.00 | $ 428,673.00 | 115% | South |
| Delaware | $ 166,327.00 | $ 308,341.00 | 85% | South |
| Florida | $ 1,484,799.00 | $ 2,308,698.00 | 55% | South |
| Georgia | $ 923,505.00 | $ 1,194,117.00 | 29% | South |
| Kentucky | $ 288,438.00 | $ 612,957.00 | 113% | South |
| Louisiana | $ 479,260.00 | $ 498,089.00 | 4% | South |
| Maryland | $ 645,620.00 | $ 1,473,947.00 | 128% | South |
| Mississippi | $ 266,196.00 | $ 294,290.00 | 11% | South |
| North Dakota | $ 26,796.00 | $ 100,556.00 | 275% | South |
| Oklahoma | $ 384,060.00 | $ 569,835.00 | 48% | South |
| South Carolina | $ 405,238.00 | $ 501,440.00 | 24% | South |
| Tennessee | $ 421,807.00 | $ 709,434.00 | 68% | South |
| Texas | $ 2,315,899.00 | $ 3,708,287.00 | 60% | South |
| Virginia | $ 723,767.00 | $ 1,264,435.00 | 75% | South |
| West Virginia | $ 61,944.00 | $ 301,038.00 | 386% | South |
| Alaska | $ 154,650.00 | $ 332,238.00 | 115% | West |
| Arizona | $ 618,571.00 | $ 1,035,468.00 | 67% | West |
| California | $ 4,166,573.00 | $ 9,382,122.00 | 125% | West |
| Colorado | $ 466,551.00 | $ 895,873.00 | 92% | West |
| Hawaii | $ 117,101.00 | $ 217,459.00 | 86% | West |
| Idaho | $ 95,494.00 | $ 258,502.00 | 171% | West |
| Montana | $ 71,994.00 | $ 212,206.00 | 195% | West |
| Nevada | $ 182,092.00 | $ 276,677.00 | 52% | West |
| New Mexico | $ 149,077.00 | $ 474,233.00 | 218% | West |
| Oregon | $ 404,255.00 | $ 711,688.00 | 76% | West |
| Utah | $ 133,963.00 | $ 342,621.00 | 156% | West |
| Washington | $ 488,314.00 | $ 1,040,326.00 | 113% | West |
| Wyoming | $ 56,199.00 | $ 144,190.00 | 157% | West |
Methodology: Using data from the Bureau of Justice Statistics for 2001 and 2018, we subtracted the spending difference for each state and computed the percent changed.
Spending has increased the most in the west
Taking a closer look at spending by region, our research shows that prison spending increased the most in western states.
- On average, western states saw a 124% increase in spending between 2001 and 2018.
- The south wasn’t far behind with a 99% increase in spending.
- The northeastern states dealt an 86% hike.
- States in the midwest kept their increase to 62%.
Eight out of the 13 states in the west more than doubled spending between the 17-year timeframe.
- New Mexico’s spending, for example, went up by 218%; one of the highest increases in the U.S.
- Montana’s spending went up by 195% and it’s neighbor to the west, Idaho, went up by 171%.
- Alaska, California, Utah, Washington, and Wyoming all had increases above 113%.
Why spending varies so much by state
The cost to maintain prisons across the nation varies greatly and depends on so many factors, from incarceration rates and sentencing rules to average wages and staffing costs. To understand how and why each state spends revenue on its prison system requires a deep-dive into specific state budgets, prison regulations, and laws.
However, there are a few factors that contribute to increased spending universally, which include:
Wages are climbing
Wages for corrections officers and prison staff vary widely, but as with any wage, they typically rise each year. The cost to employ officers and staff to keep a prison running is the largest piece of the prison budget.
Ratio of officer to inmate varies
Nationwide, the average officer-to-inmate ratio is one officer per five inmates. However, the ratio varies by state. South Dakota and Nevada, for example, have one officer for every seven inmates while Vermont and Massachusetts have one officer for every three inmates.
Two prisons could have the same number of inmates, but one could employ more corrections officers than the other to maintain a certain officer-to-inmate ratio.
More people are being sent to prison
Research shows the likelihood of a person being convicted of any major crime has climbed sharply in the last three decades. The likelihood of going to prison for a drug-related offense went up by 350% between 1980 and 2010, according to the National Resource Council.
Prisoners are serving longer sentences
Research also shows the average time behind bars has gone from 17 months to 35 months, according to Pew Research. This increase applies to all prisoners, no matter what kind of crime landed them in prison. With more prisoners staying inside longer, the cost to house, feed, clothe, and educate climbs as well.
Breakdown of prison costs
The state budget for prison costs includes a variety of expenses, most of which breakdown into three categories, according to a Vera Institute of Justice report:
Salaries
Almost 70% of the money spent to maintain a prison is spent on staffing. The money goes to salaries, overtime, and benefits for the people who work for the prison.
As might expect, states with high spending employ the highest number of corrections system employees. California’s department of corrections department employs 57,809 people, for example, and Texas employs 40,772, according to the United States Department of Justice.
Inmate healthcare
An estimated 11% of the budget is spent on inmate healthcare. Costs vary by state and largely depend on how much the prison handles healthcare in-house or contracts it out.
Miscellaneous expenses
The rest of the budget goes towards a variety of things, like paying utility bills and performing building maintenance on aging facilities.
Boarding
Another expense that can’t be overlooked is boarding costs. Some states rely on private prisons to house and care for inmates. When this occurs, the state pays a boarding fee. There are sixteen states, including Connecticut, Delaware, and New York, that don’t use private facilities at all. As a result, no money is spent onboarding.
Tennessee, however, spends 35% of its budget on private boarding fees, with Louisiana and Montana following behind with 33% of its budget doled out to private facilities, according to data compiled by Vera.
How many prisoners are in each state?
Across the U.S., there’s a total of 1.46 million inmates being held in both federal and state prisons, as of 2018, according to the U.S. Department of Justice. The population has actually decreased by 1.6% from 2017.
The majority of prisoners are held in state facilities, as opposed to federal ones. Of the 1.46 million inmates behind bars, just under 180,000 of them, or about 12%, are in federal prisons.
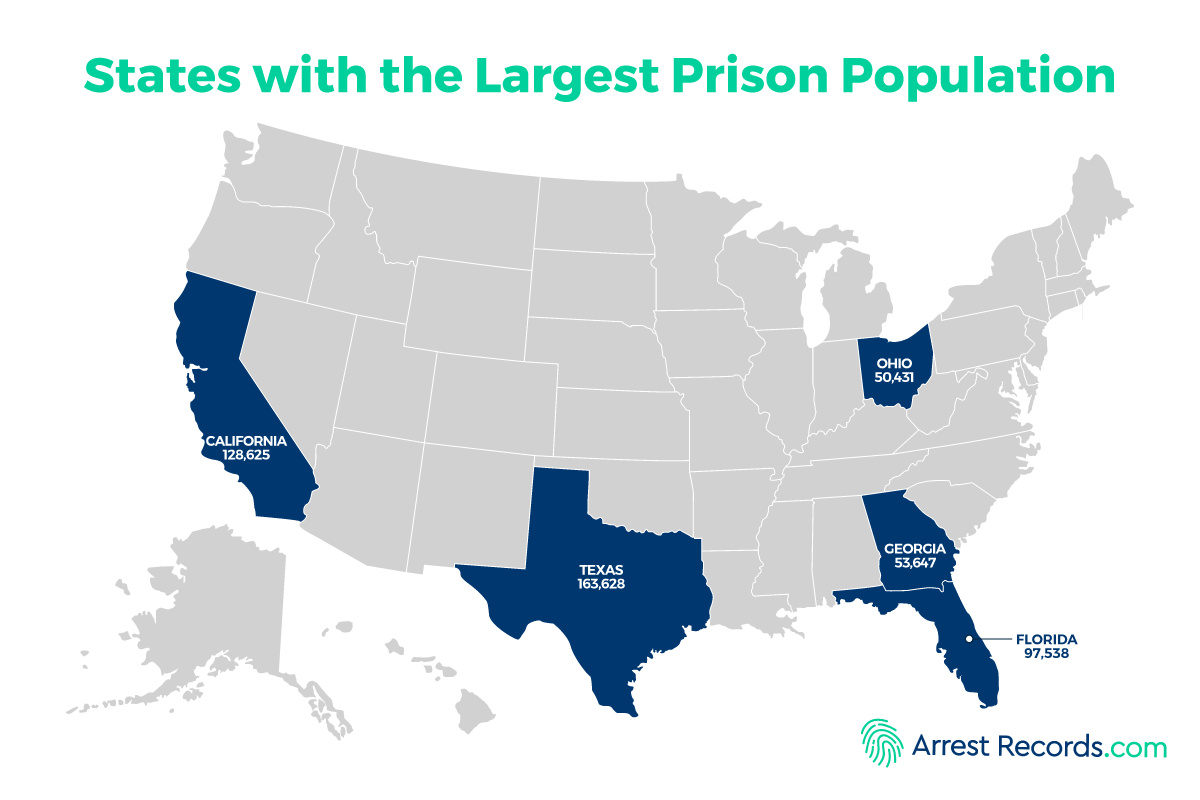
States with the largest prison population
Texas has the highest inmate population with 163,628 inmates in its system. California comes in second with 128,625 and Florida is just shy of a six-figure population at 97,538.
The next two states in line are significantly less than these three states. Georgia has about half of Florida’s population with 53,647. Ohio takes fifth place with 50,431 inmates.
Top five states with the highest inmate population:
- Texas – 163,628
- California – 128,625
- Florida – 97,538
- Georgia – 53,647
- Ohio – 50,431
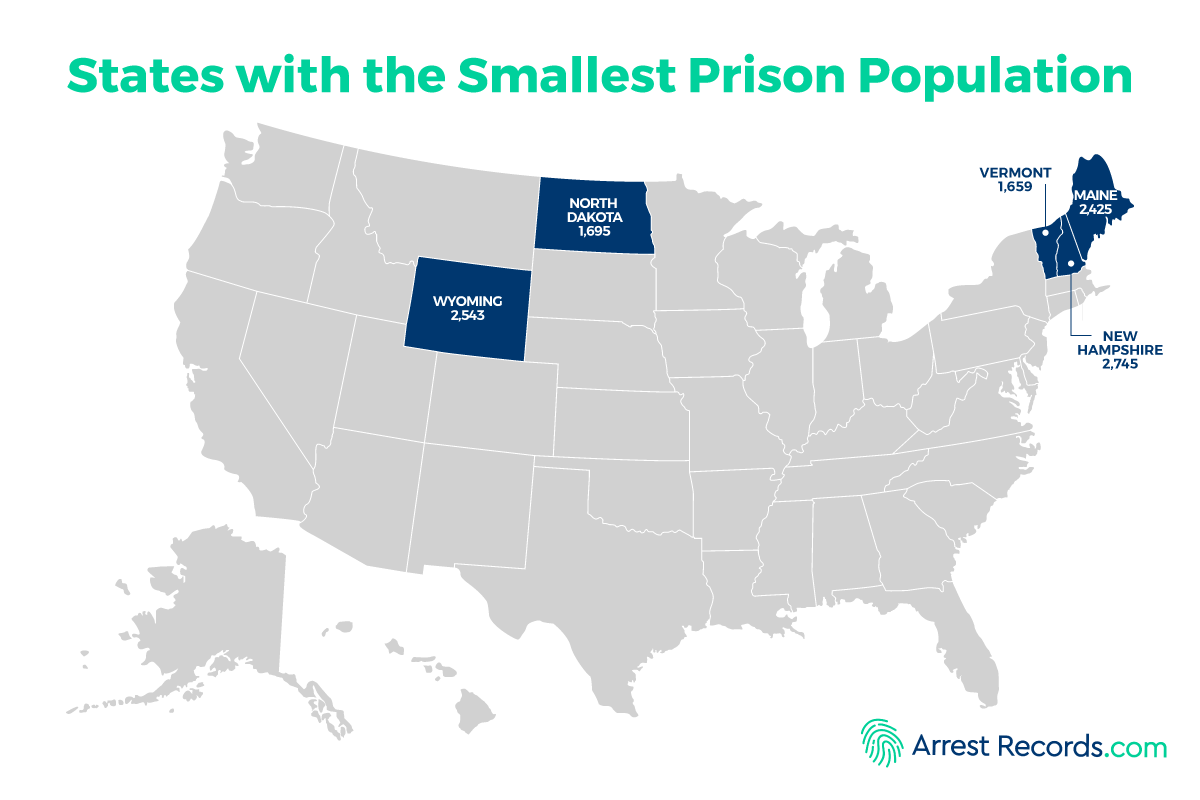
States with the smallest prison population
On the opposite end of the population spectrum, Vermont has the fewest inmates in its state prisons. The Green Mountain State has just 1,659 inmates.
North Dakota is close to Vermont’s total with 1,695 inmates. Maine and Wyoming hover around 2,500 apiece and New Hampshire has a few hundred more inmates at 2,745.
Top 5 states with the lowest inmate population:
- Vermont: 1,659
- North Dakota: 1,695
- Maine: 2,425
- Wyoming: 2,543
- New Hampshire: 2,745
Why prison populations vary by states
The number of prisoners being held in each state varies greatly. Why? There’s a lot at play. From the state’s population and incarceration rates to criminal justice legislation that’s passed at the state or county level, many things can impact a prison’s population.
Maryland, for example, dropped its prison population by almost 10% after enacting a 2016 law that reduced prison sentences for non-violent offenders, according to the Vera Institute.
In Texas, its prison population has decreased by 17% over the last ten years. However, when you drill down to the prison population by county, it paints a different story.
For instance, Dickens County decreased its prison population by 99% while a county a few miles north, Hemphill County, had a 511% increase in its population, according to a different report from the Vera Institute. Changes in the number of arrests and pre-trial detention could contribute to these disparities.
More in-depth understanding of prison populations requires a micro-level examination of the state and county’s criminal justice system and legislative system.
Nationwide demographics of prisoners
Of the 1.4 million prisoners across the U.S., the vast majority – 92% – are male. Of the male prisoners, 34% are Black, 29% are White, 23% are Hispanic, and 14% are categorized as Other, according to the U.S. Bureau of Justice.
Almost half (47%) of men are between the age of 25-39.
Eight percent of the nation’s prison population is female. Of those, 46% are White, 18% are Black, 18% are Hispanic and 16% are categorized as Other, according to the U.S. Bureau of Justice.
More than half (54%) of all women are between the age of 25-39.
How much do families spend on imprisoned family members?
While states have dedicated prison budgets, there are still some costs that aren’t covered. Families of those incarcerated often have to foot the bill for additional expenses like commissary accounts and long-distance phone calls.
The Prison Policy Initiative estimates that families spend $2.9 billion on their loved ones who are behind bars. That number doesn’t include the average $13,000 that family members pay in fines and fees, says The Marshall Project.
The cost to communicate is a hefty one as well. Aside from the cost of long-distance calls, postage, and travel expenses to visit, inmates can purchase a tablet and email family. However, there’s a cost to send each email.
Family members can send inmates items like clothes, but they can’t be purchased at a local store and mailed to the prison. Instead, they must be purchased through approved vendors that deliver to the prison, which increases the cost of most goods.